
An updated look at how podcasts are performing around the globe, from our head of Podcast Strategy.

Early last year, I wrote a blog post titled “By The Numbers” which covered a range of data points related to how podcasts published on Triton Digital's Omny Studio (we host around 55,000 rss feeds today) were being downloaded across the globe.
Fun fact: podcast publishers consume data like no other species on Earth and their appetite is seemingly insatiable. Which means that I am asked fairly constantly to release new and updated figures. So, proving that persistence is indeed the key to success, I’ve dug through the billions of downloads over the past 12 months in the Omny databases and hope you enjoy this follow up.
For anyone looking for updated benchmarking data, good things to those who wait :)
There is a lot of podcast content out there, spread out over hundreds of categories and sub-categories. At the time of writing this, Podcast Index tells me there are over 4 million podcasts with almost 1100 new shows in the last 30 days. But what are people listening to?
For Omny hosted content, the percentages of listening breakdown in the top 10 categories looks like the below.
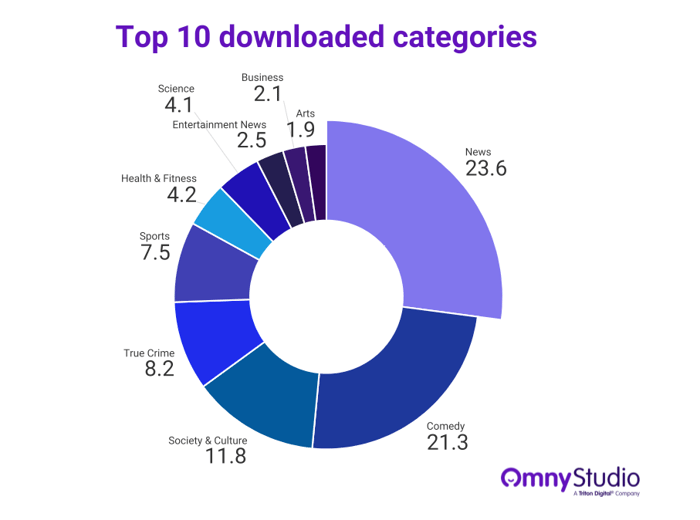
Omny Studio data: 12 months ended May 31st 2022
Largely, numbers are pretty consistent from last year. News and Comedy take out the top share again, with the usual suspects bringing up the rear.
What is interesting is that whilst News has stayed flat, Comedy has gained 2% share from True Crime and Society & Culture with the other trailing categories seeing minimal shift.
What if we look at it across three key regions?
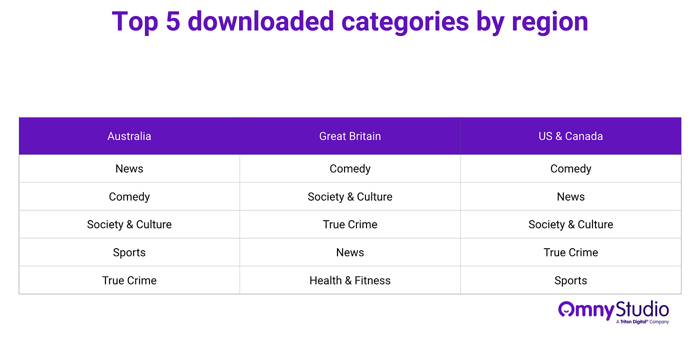
Omny Studio data: 12 months ended May 31st 2022
Fairly consistent proof that people love to laugh.
How are people listening?
After some fairly monumental shifts between 2019 and 2020 brought about by consumption shifts in the first year of the pandemic, the latest comparison is a lot more stable.
Shout out to Connected TV, still hanging onto that 0.05% whilst other devices saw slight decreases.

Fairly unsurprisingly, mobile is the clear winner across regions with TV hanging on by a thread everywhere.
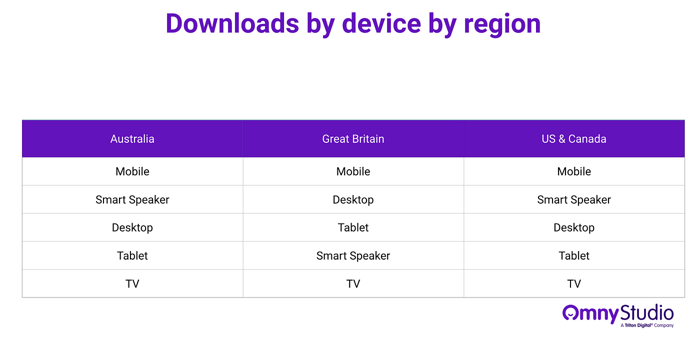
The fluctuation in the middle is worth noting though, given each region has a completely different order of preference. And the US is the clear reason that Smart Speaker usage is as high as it is, with 6.9% of downloads on the device over there (compared to 3.71% and 2.21% in Australia and the UK, respectively).
Where are people listening?
Here’s the big crowd pleaser, to wrap us up — what platform are people listening on? This is hotly debated in the industry, with a lot of platforms claiming (and a good amount of providers/reporters claiming on behalf of the platforms) they are number one.
Obviously, our data is only our data. We host a huge portion of the industry, but it’s just that — a portion. Disclaimer done, legal happy…

*A note on the above from the last time we ran this data over 18 months ago- we included Apple Core Media as Apple Podcasts. For those interested, in 2020, that was 16.8% and in 2021, 14.2%. This year, we’ve pulled those UA’s apart (shout out to every app builder out there who seems unable or unwilling to name your UA) which is why Apple Podcasts only shows a slight drop and Other doesn’t show a gain.
As you can see, it’s still largely a two horse race between Apple and Spotify. Though Google and Amazon have gained share with Omny shows, almost all other independent apps are down — some perhaps losing share from newer entrants in the space.
If I had to note one major disappointment this year, it would be Facebook pulling out of this race. 2021 had them at 0.68% share and while it sounds small, it was already substantially higher than some podcast apps who have been in the game for years.
Happy podcasting, everyone.