Our head of Podcast Strategy attempts to answer the burning question on every podcasters lips when it comes to downloads.
Earlier this year, I wrote a blog post titled By The Numbers (2022 Edition), which covered a range of data points related to how podcasts are being downloaded across the globe. Along with the usual suspects of category and platform downloads, when I wrote the first version of that blog in 2021 I also shared Omny benchmarking data for the first time — giving a glimpse into what an average podcast receives in downloads 30 days after release.
Since writing the original 2021 blog, updated benchmarking data has been the number one request I get from clients and others in the industry. And I do truly mean the number one request. Well, ask and you shall receive — the Omny team have crunched the numbers and I’m back with new data. And this year, I’m breaking it down by category and geography too. Let’s dive in.
How many downloads is “good”?
Disclaimer: I love data (who doesn’t) and the stories that data can tell us are incredibly useful in podcasting. I’m going to use the term “good” in the graphs that follow because that’s the way the question is always framed to me by publishers.
I’m putting “good” in quotations to remind you that it’s a subjective term and a shows success is not always measured by downloads. Success is defined by the goals and aim of the podcast, not always on charts or downloads.
I’ll let you in on a secret — The voice keeping you up at night, hauntingly whispering the question that plagues you as a podcast creator -“Is my podcast getting a good number of downloads?”- is the same voice all publishers hear. Big, small, independent or part of a network- the question is there for everyone.
Are we ready for some comfort food? Ok, let’s nourish ourselves with data showing global downloads across all categories.
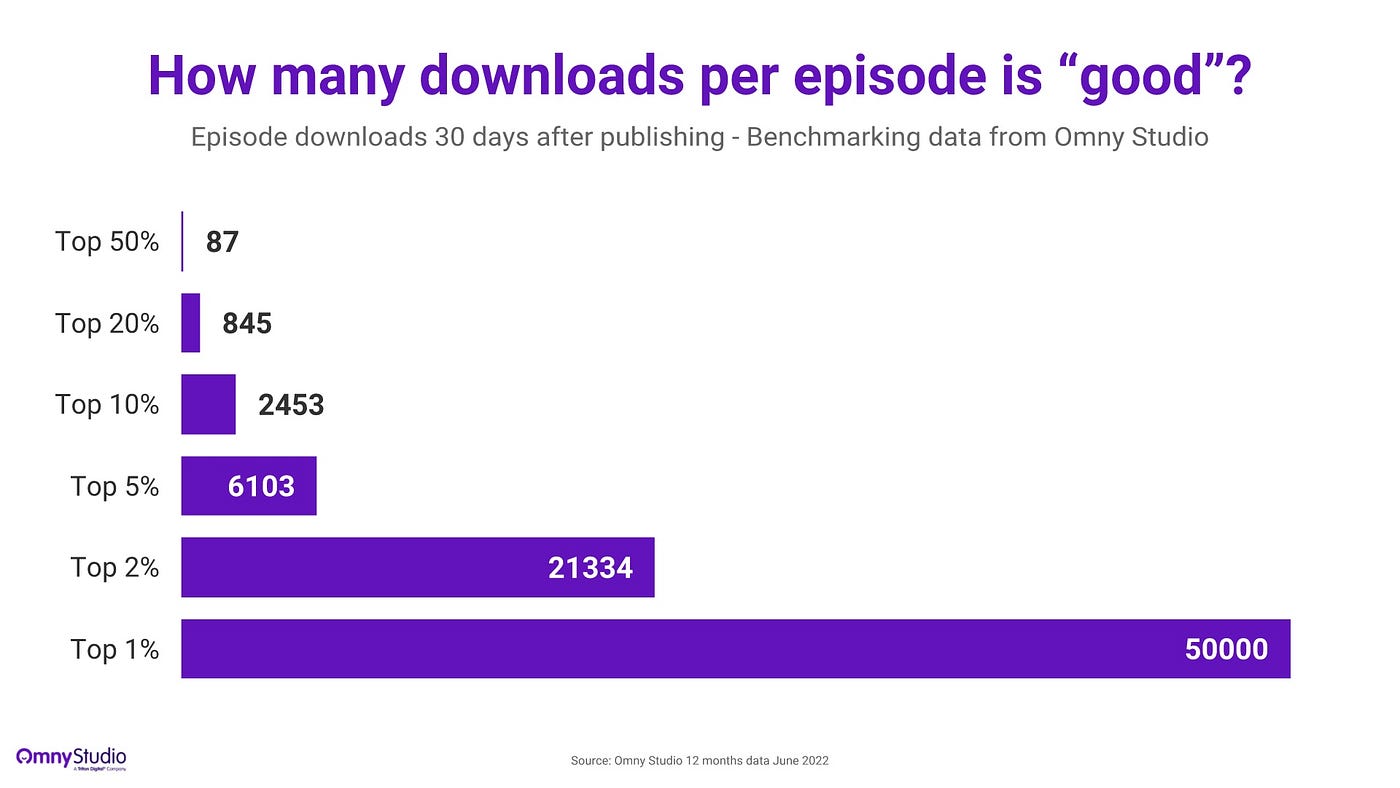
A brief reminder on how to read this data — the above tells us that a publisher with Omny Studio, seeing more than 87 downloads per episode in the the 30 days after release is within the top 50% of podcasts we host. Publishers receiving over 50,000 downloads are our top 1%.
Now, it’s been over a year and a half since we ran this data last (the last data coming from October 2020), so the growth needs to be looked at through that lens. That said, interesting to note the entire range has expanded — lowest down to 87 (from 100) and highest to 50,000 (from 28,000). Way to go, podcasting.
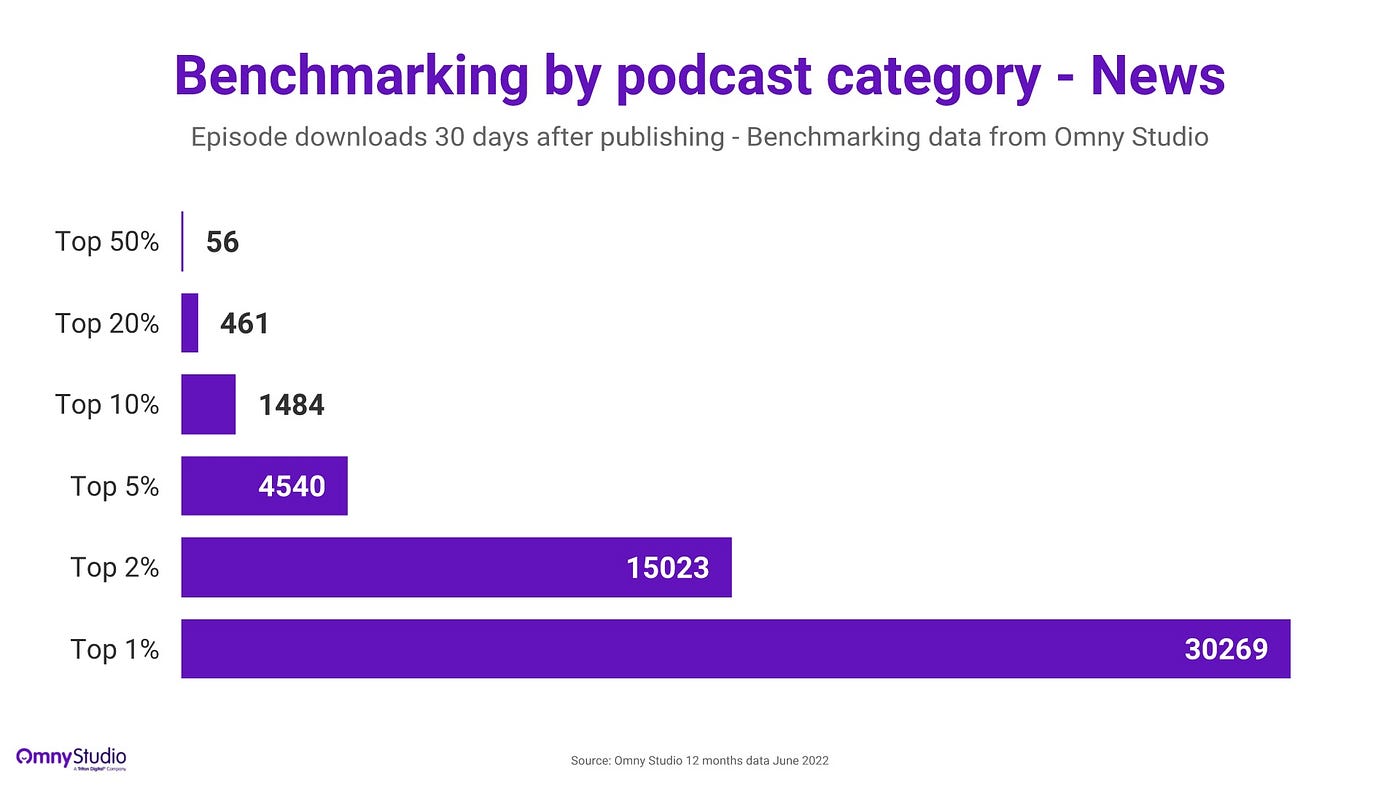
What happens if we slice the data by category? Let’s start with News, where each percentage bracket has dropped at least 50% since last data reported, which makes reaching the upper echelons a lot more accessible to new entrants. Could people be recategorizing to get into less crowded sections?
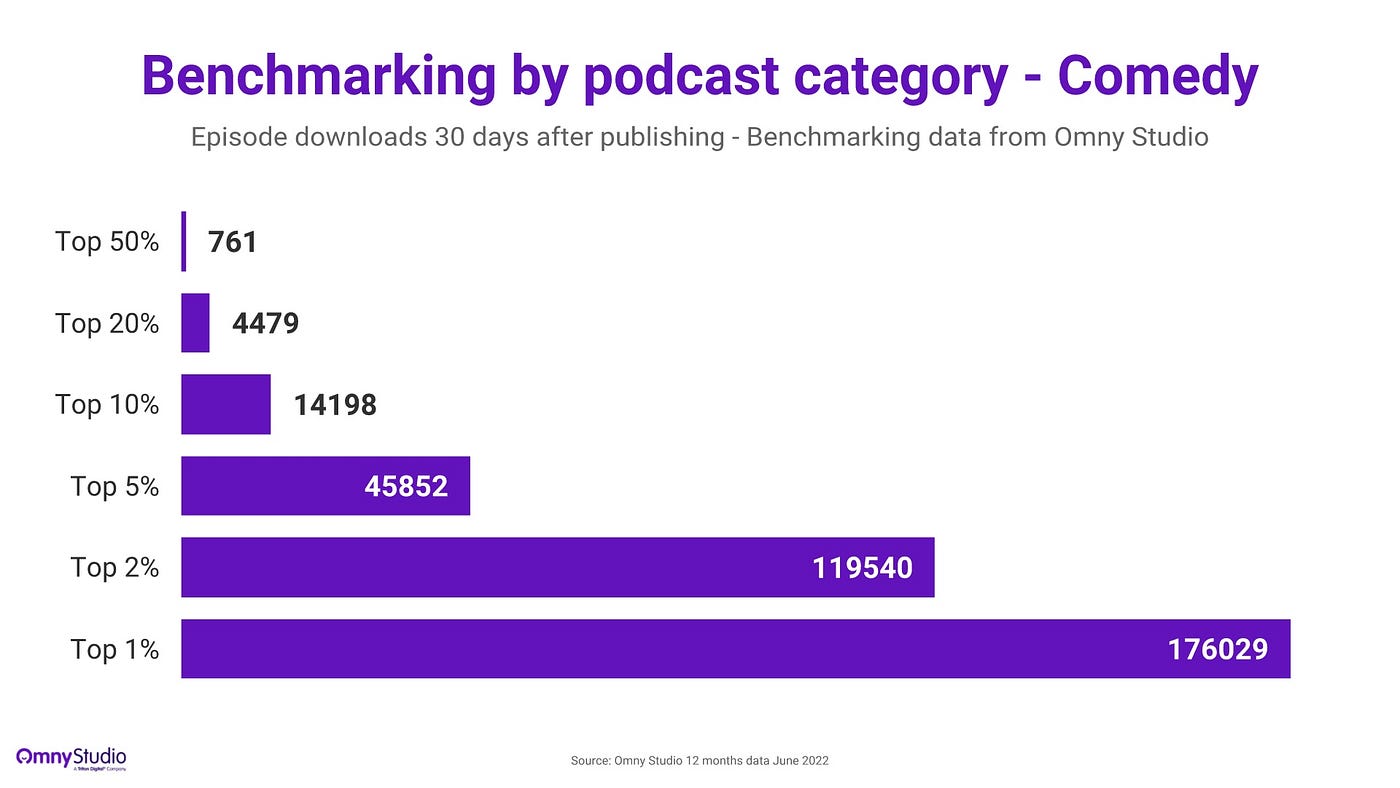
Moving onto the other top categories we see globally, the data has remained relatively steady. Comedy continues to bring tears to the eyes with the numbers needed to hit the top 1%. Though top 2% and 3% have increased by 50% and we’re seeing a more even spread. More popular shows, perhaps. Who doesn’t love to laugh?
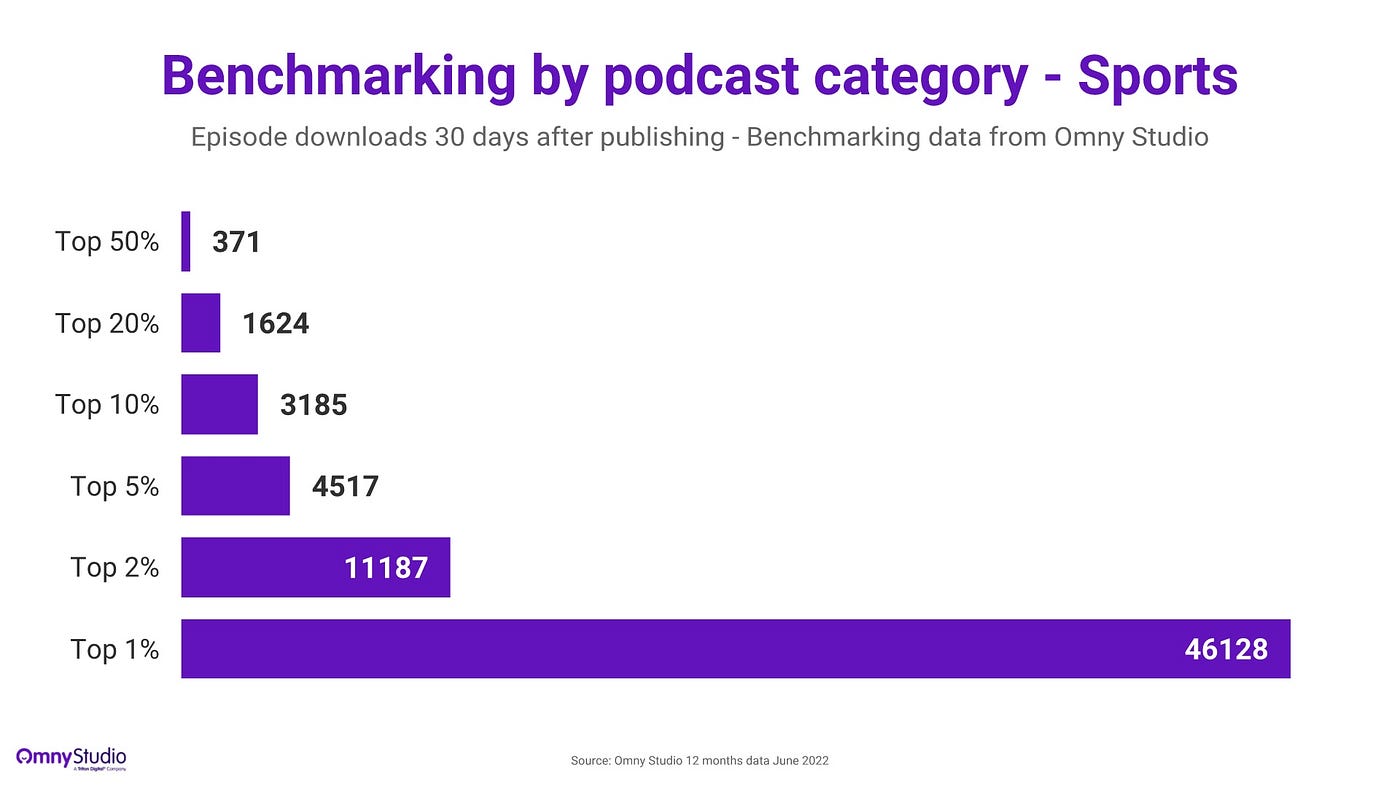
Sports data is the most similar to this time last year, except for the top 1% who have blown way past the competition from 14,500 to 46,128.
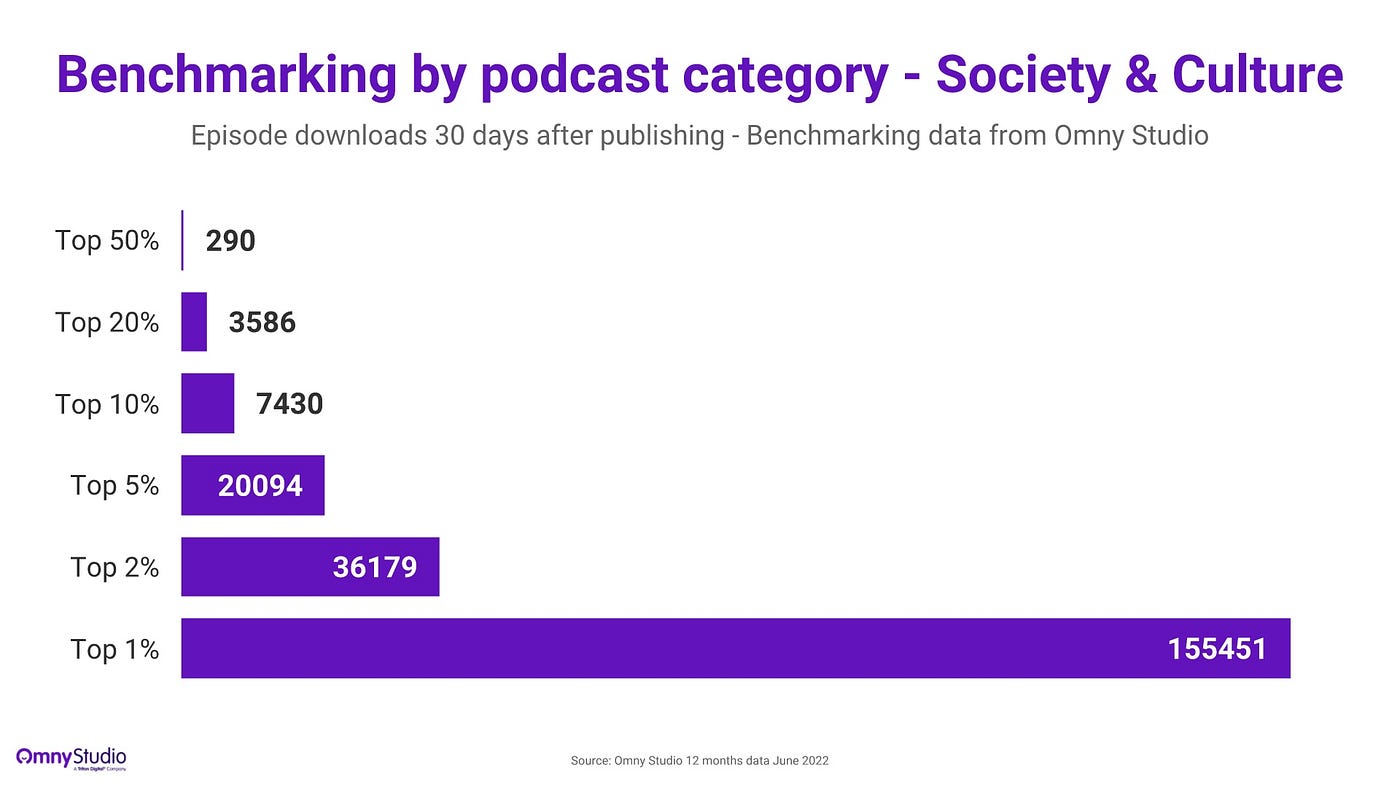
Big shout out to Society & Culture where the top 1% have pulled away to over 4x lead over the 2%, compared to last data pull where they were barely 2x ahead.
Are we full yet or still hungry for a bit more data?
In that case, for dessert we whipped up some country specific data. Looking at downloads across all categories for Australia, the UK and US/Canada we see the below.
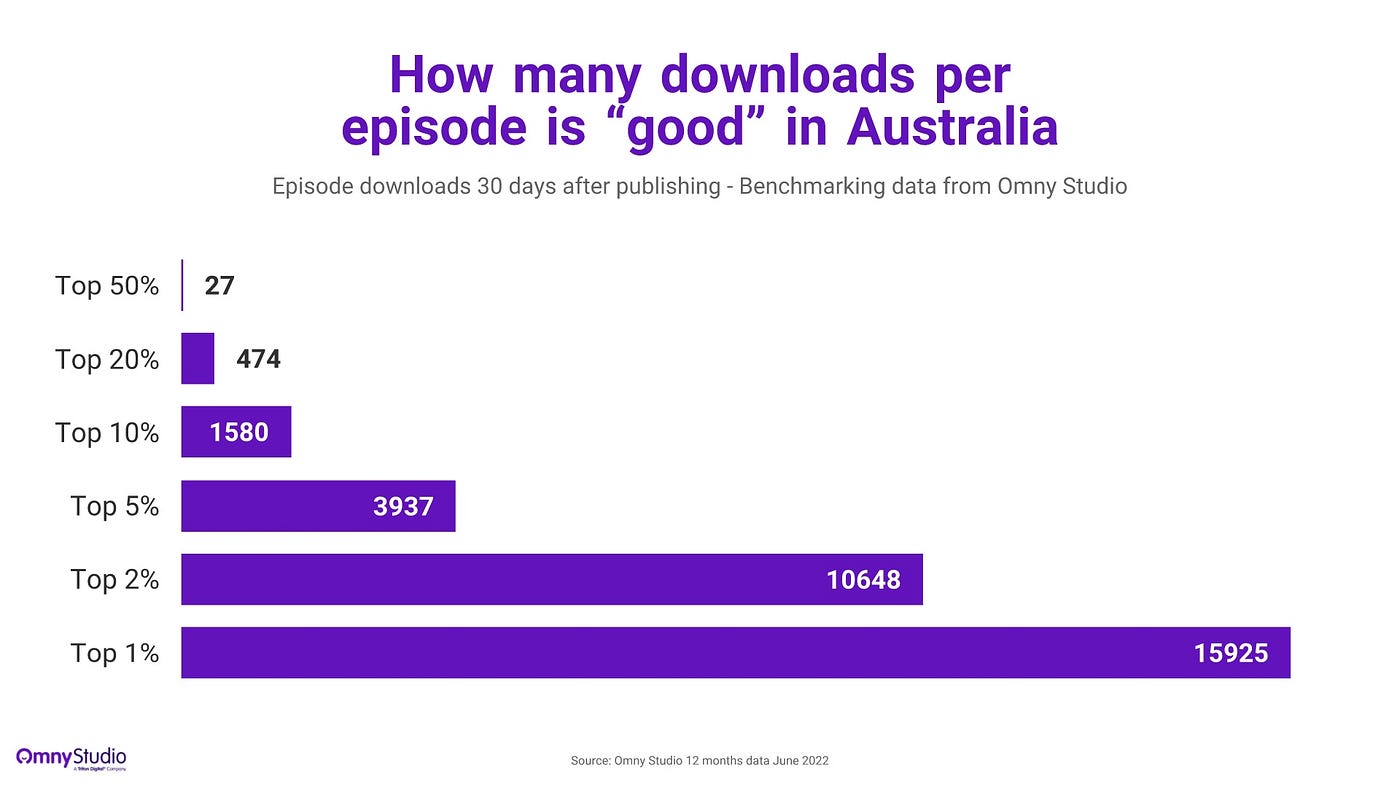
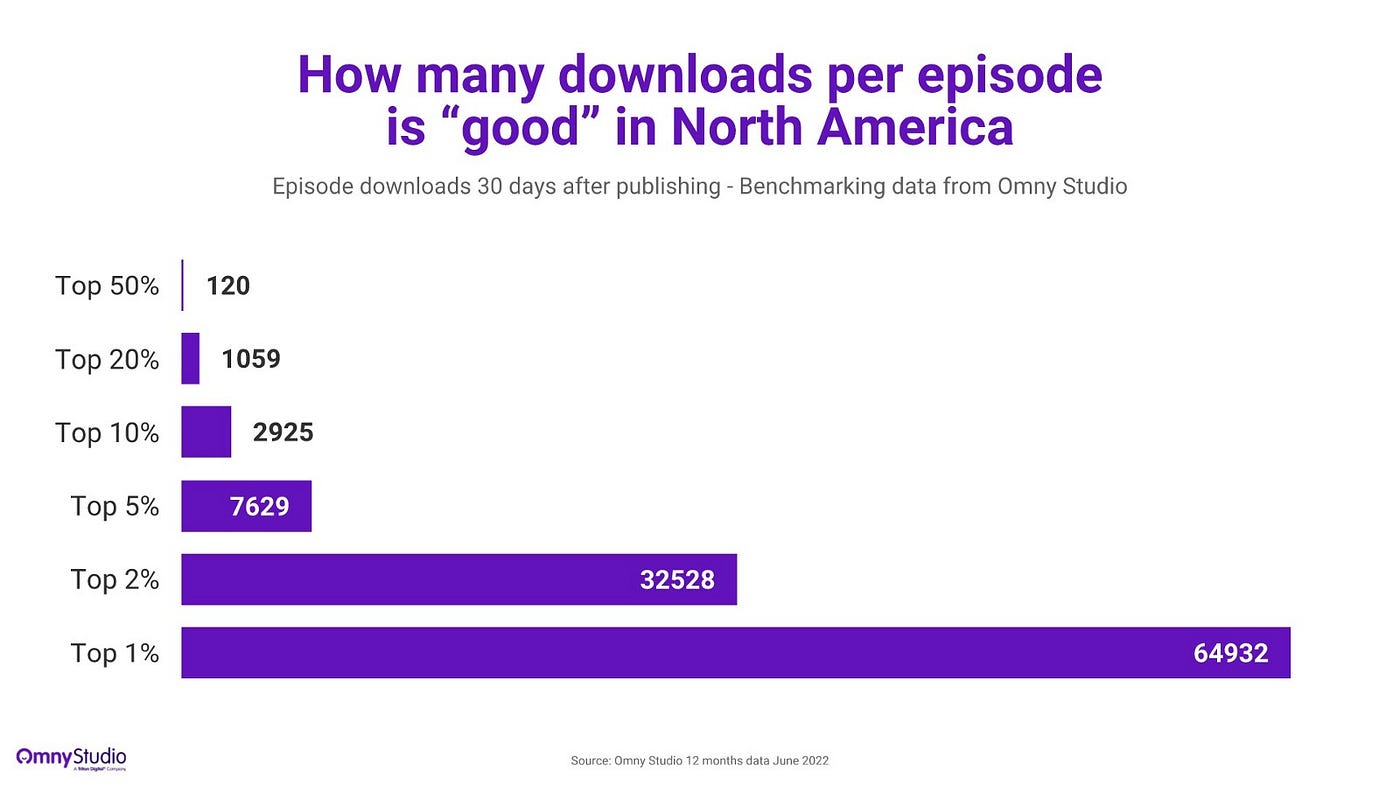
No real surprises with North American data being so similar to our global data, given the majority of downloads originate in the US and Canada. Or with the UK and Australia having lower and similar numbers, given the country size and makeup.
That’s a wrap
Ok friends, the benchmarking data kitchen is closed for another year. I hope you enjoyed the meal and have stored enough to get you through the next 12 months where I’ll inevitably succumb to public pressure again and be back with the 2022 numbers.
Until then, happy podcasting everyone.