December 2015 Insights & Trends

January 28, 2016
Desideria Mastriaco

Triton Digital has released its monthly digital audio Top 20 Ranker for December 2015. The Ranker is a listing of the top-performing digital audio stations and networks measured by the Webcast Metrics® audience measurement platform.
Before diving in to the December 2015 data, we wanted to take a moment to look back at the past year. It’s been an incredible year for audio as a medium and our industry as a whole. Here are a few highlights.
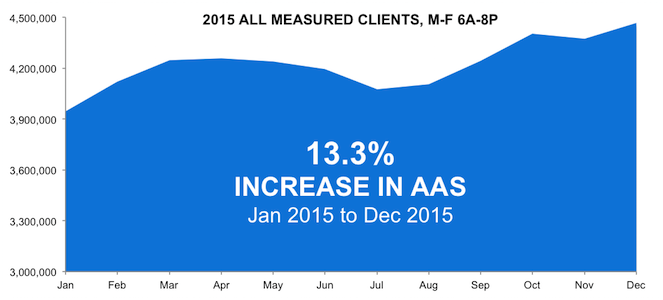
Overall streaming reached an all-time high in 2015. Over the course of the year, Average Active Sessions (AAS) increased by 13.3 percent for the Domestic Monday-Friday 6:00AM-8:00PM daypart and by 13.6 percent for the Domestic Monday-Sunday 6:00AM-Midnight daypart.

In breaking out mobile and desktop listening, we again saw impressive year-over-year growth in mobile listening. AAS on mobile increased by 22.2 percent (M-F 6A-8P), while desktop increased by 5.2 percent.
All measured clients within the Domestic U.S. reported a total of 4,464,545 Average Active Sessions (AAS) during the Monday-Friday 6:00AM-8:00PM daypart, and 3,765,321 AAS during the Monday-Sunday 6:00AM-Midnight daypart.
Overall AAS declined 13.4 percent (M-F 6A-8P) during the week of Christmas when compared to the three weeks prior. Mobile listening declined by 2.8 percent, while desktop listening dropped 37.3 percent. Pureplay listening was down 10.4 percent, while broadcast streams declined by 33.8 percent. These listening patterns are consistent with 2014 trends.
When compared to November 2015, the Holiday format showed the largest listening gains with a 321.5 percent increase in AAS, followed by Oldies (29 percent), Modern Adult Contemporary (25.1 percent), Adult Contemporary (17.4 percent), Alt/Modern Rock (14.3 percent), and Classic Hits (10.6 percent). This trend is typical for this time period, as many stations change to the Holiday format right after Thanksgiving.
(M-F 6A-8P)

Looking at the top 20 markets, Seattle showed the largest listening gain from November 2015 with a 5.8 percent increase in AAS, followed by Orlando (3.8 percent), Pittsburgh (3 percent), and Baltimore (2.2 percent).
(M-F 6A-8P)

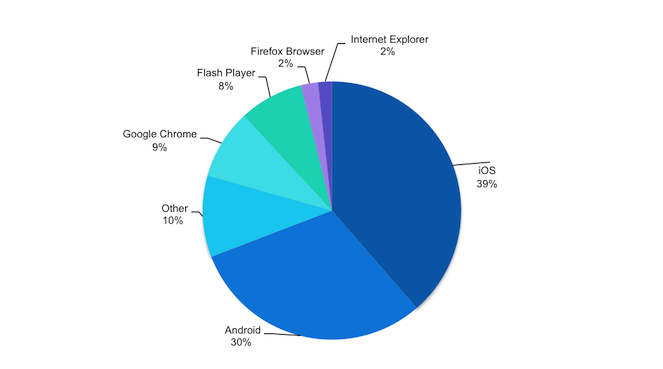
39 percent of listening took place on an iOS device, followed by Android at 30 percent, Google Chrome at 9 percent, and Flash Player at 8 percent.
(M-F 6A-8P)
