September 2016 Insights & Trends

Triton Digital has released its monthly digital audio Top 20 Ranker for September 2016. The Ranker is a listing of the top-performing digital audio stations and networks measured by the Webcast Metrics® audience measurement platform.
Our review of the September 2016 data uncovered several interesting stats about listening growth and audience trends. Check them out below.
Total Listening in September 2016
All measured clients within the Domestic U.S. reported a total of 4,824,772 Average Active Sessions (AAS) during the Monday-Friday 6:00AM-8:00PM daypart, and 4,073,728 AAS during the Monday- Sunday 6:00AM-Midnight daypart.
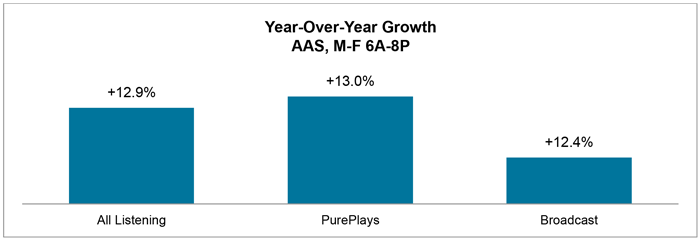
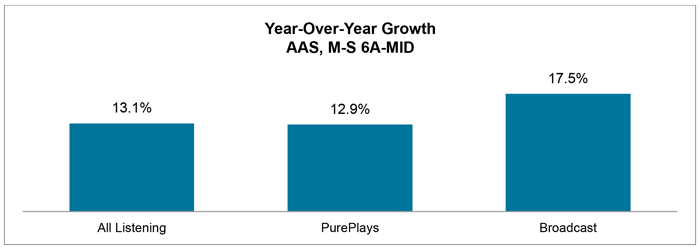
Year-Over-Year Listening (September 2016 vs. September 2015)
Overall streaming has seen steady growth when compared to September 2015. Both Pureplays and AM/FM Broadcasters showed positive growth during the Monday-Friday 6:00AM-8:00PM daypart and the Monday-Sunday 6:00AM-Midnight daypart.
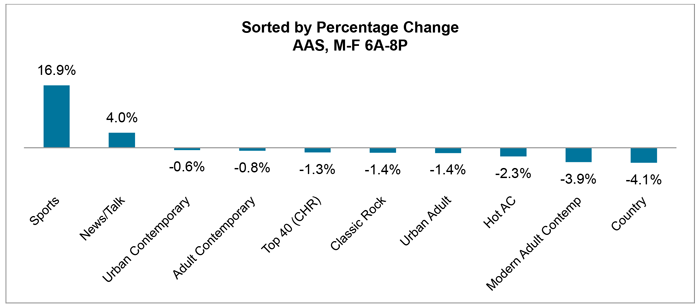
Top 10 Formats (September 2016 vs. August 2016)
The Sports format showed the largest listening gains with a 16.9 percent increase in AAS, followed by News/Talk at 4.0 percent. The Sports format received a big boost with the return of the NFL this month.
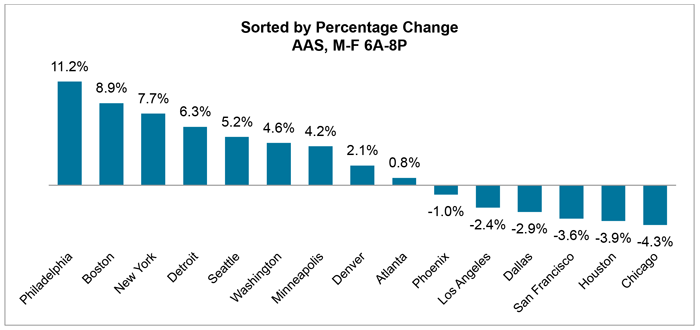
Top 15 Markets (September 2016 vs. August 2016)
Top Devices in September 2016
41% of listening took place on an iOS device, followed by Android at 32%, Google Chrome at 8% and Flash Player at 8%. During the same period last year, 37% of listening took place on an iOS device, followed by Android at 31%, Google Chrome at 9% and Flash Player at 9%.
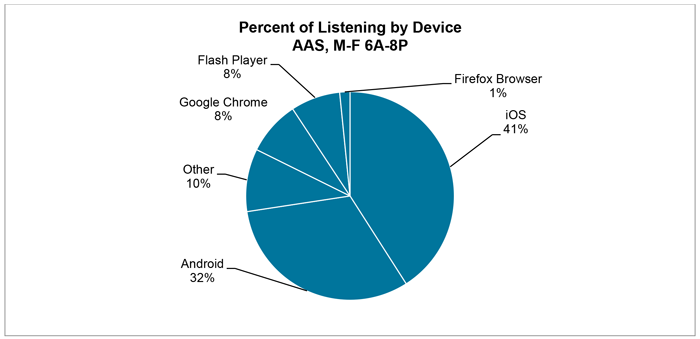
*The category ‘Other’ consists of devices, types and browsers that are less than 2% of total audio consumption and audio consumption that cannot be classified
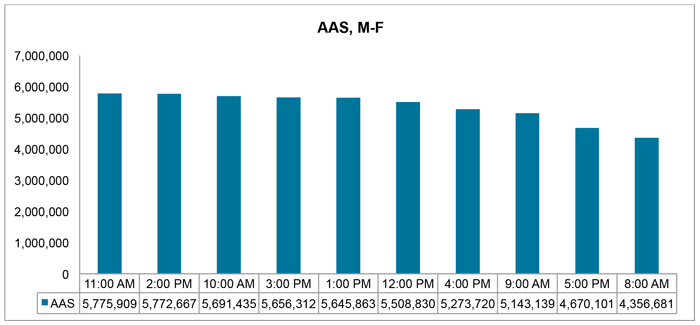
Top Listening Hours in September
Average Time Spent Listening for September 2016 vs. August 2016
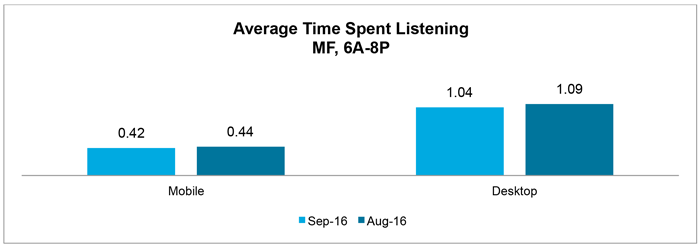
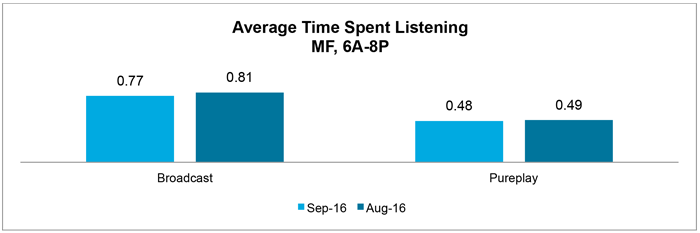
ATSL = The average number of hours for each session with a duration of at least one minute in total and any duration within the reported time period.
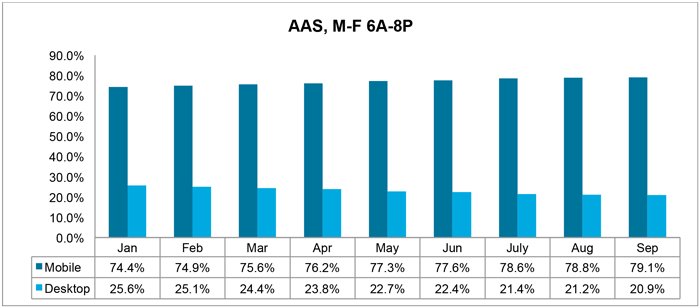
Year-to-Date Mobile vs. Desktop Breakout
Mobile listening represented 79.1 percent of total listening in September 2016, compared to 20.9 percent on desktop. Mobile listening has increased 4.7 percent since the beginning of 2016.
Digital Audio Trends and Insights represent all clients measured by Triton.
Back to blog
Related Articles
Keep on reading the stuff you love
Dynamic Ad Insertion (DAI): Tips to Monetize Your Content
How Podcasts Took Over the World 20 Years Ago